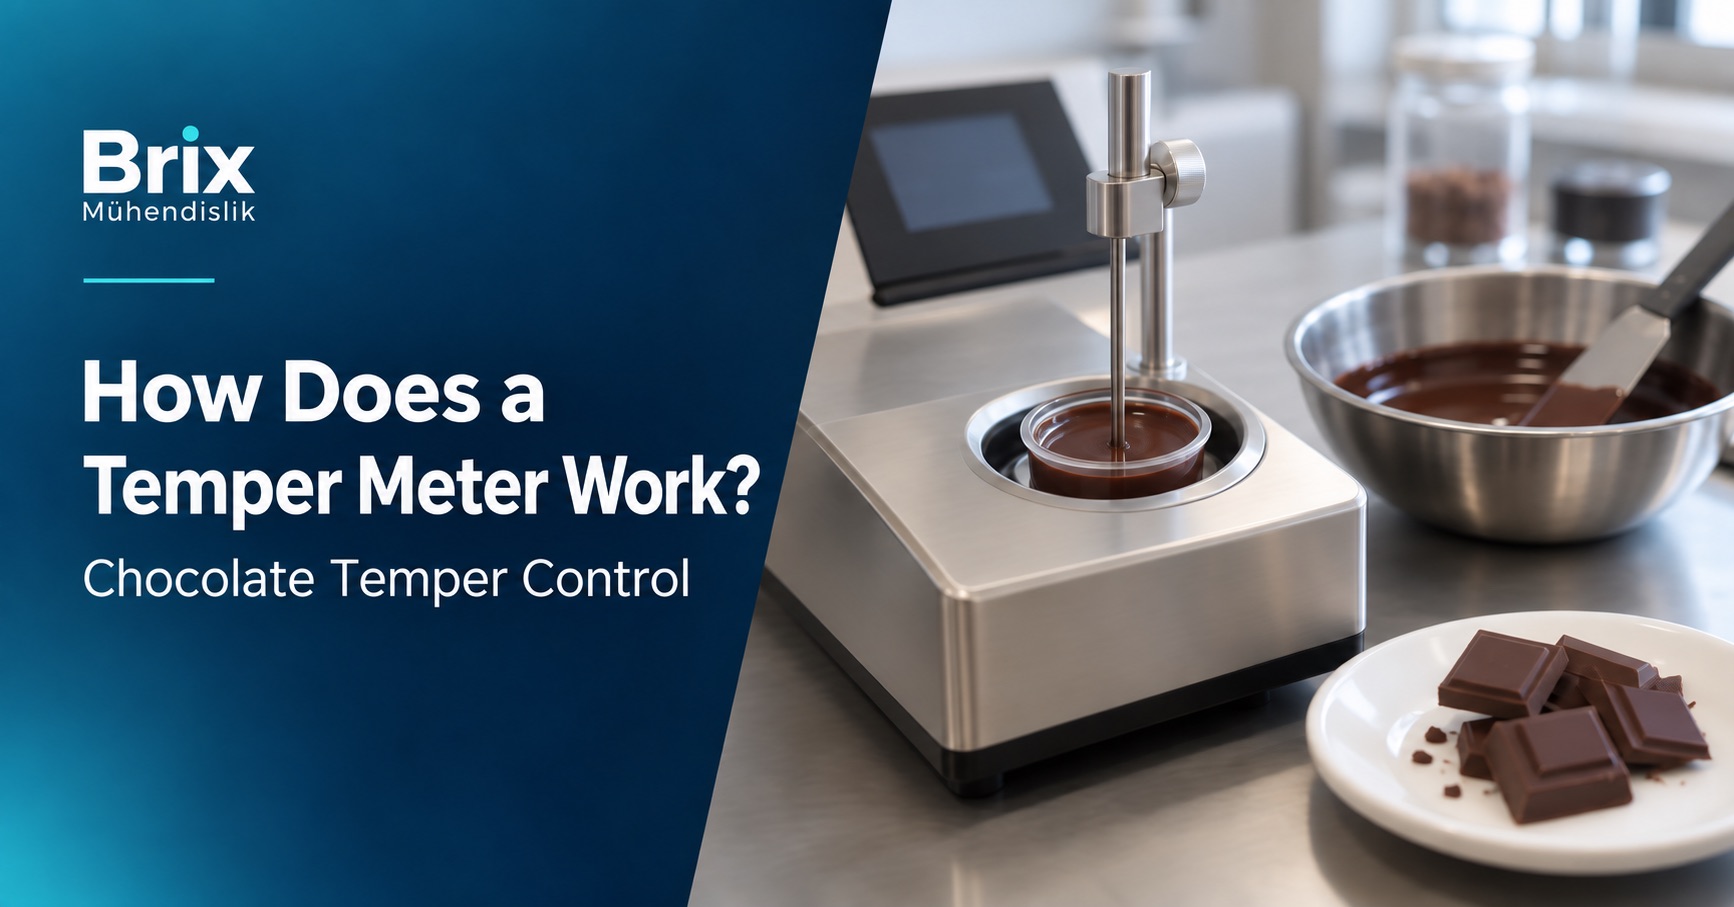
The Tempermeter is a simple device with a cooling cell and a temperature measurement probe that plots the temperature/time data it obtains.
So how can the tempermeter provide us with information about the crystallization state/degree of cocoa butter, which is quite complex?
The secret lies in measuring the energy/heat released during the crystallization of cocoa butter.
The tempermeter draws 3 different temperature/time change graphs, and these graphs allow us to learn about the crystallization state of cocoa butter.
1. Properly Tempered Chocolate
If the temperature increase in the chocolate due to the heat released when the cocoa butter in the cooling cell of the tempermeter starts to crystallize is the same as the temperature change (decrease) in the chocolate due to the cooling process, in other words, if the energy produced by crystallization equals the energy absorbed by the cooling system, the chocolate temperature will remain constant throughout crystallization. In this case, we will see that the temperature remains constant in the temperature/time graph drawn by the tempermeter.

2. Over Tempered Chocolate
If the temperature increase in the chocolate due to the heat released when the cocoa butter starts to crystallize is less than the temperature decrease due to the cooling process, in other words, if the energy produced by crystallization is less than the energy absorbed by the cooling system, the chocolate temperature will not remain constant and will continue to decrease. In this case, we will see that the temperature continuously decreases in the temperature/time graph.

3. Under Tempered Chocolate
If the temperature increase in the chocolate due to the heat released when the cocoa butter starts to crystallize is higher than the temperature change due to the cooling process, in other words, if the energy produced by crystallization is greater than the energy absorbed by the cooling system, the chocolate temperature will not remain constant and will suddenly tend to rise. In this case, we will see that the temperature has suddenly risen in the temperature/time graph.
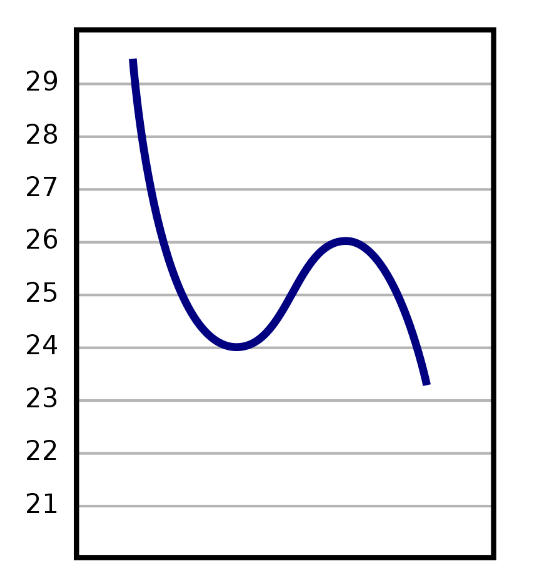
Reading the graphs provided by the tempermeter will give us sufficient information about the tempering state and tempering index of the chocolate.
You can contact us for your support requests regarding Chocolate Tempering.